Analysis · From infrastructure to use
From Infrastructure to Use
Evaluating whether payment connectivity becomes meaningful inclusion
Connectivity is an intermediate result. The development test is whether people can repeatedly complete useful activities that were previously difficult or unavailable.

The argument
GIMACPAY provides a practical setting for examining this distinction. The regional ecosystem connects six CEMAC economies within a shared monetary environment. Regional portfolio figures report expansion to more than 150 participants by 2025/26 and roughly 20.3 million transactions worth XAF 863 billion in 2025 under broader portfolio reporting. Those figures describe network scale and activity; they do not identify who benefited.
A certified institution may have few active customers on interoperable services. A merchant may display a QR code but receive mostly cash. A Treasury may accept a digital payment while continuing to reconcile it manually. These gaps explain why going live is a milestone rather than the end of implementation. Institutional readiness, affordable access and service usefulness have to survive contact with everyday routines.
My work on pricing, QR readiness and ecosystem integration leads me to treat adoption as a sequence of observable decisions. The provider enables a service, the user tries it, the payment succeeds, and the user has a reason to return. Failure at any stage limits the economic value of the preceding investment. Digital identity and data exchange may remove further barriers, but they require their own governance and cannot be presumed to exist because payments connect.
This perspective broadens the meaning of inclusion. Account access does not necessarily imply control over money; aggregate transactions do not reveal gender differences; a digital channel does not guarantee accessibility. The Global Findex 2025 combines financial inclusion measures with a Digital Connectivity Tracker [E]. That reinforces the need to study financial use alongside the devices and mobile access through which it occurs.
I hypothesize that infrastructure and its complements interact rather than contribute independently. More connected institutions may add little practical value when acceptance or affordability is the binding constraint. Once that constraint improves, the existing network can become more useful without a proportionate increase in endpoints. Testing this interaction would explain why apparently similar infrastructure investments generate different adoption patterns.
From question to implementation
A development program should specify the particular journey it intends to improve. For a microenterprise, that might be receiving a payment from a customer on another provider. For a public institution, it might be matching a collection to the correct obligation without manual intervention. For a benefit recipient, it might be receiving and using funds without excessive travel or fees. Each journey calls for a different result indicator.
The framework below separates outputs, behavior, and economic outcomes. It is an analytical proposal derived from implementation experience, not a validated causal model. The arrows require complementary conditions: reliable connectivity, clear rules, practical skills, liquidity, and user confidence. Government service integration also requires changes in administrative processes and responsibilities.
Evaluation should use cohorts and consistent denominators. Follow users after onboarding, examine repeated successful journeys, and record why people stop. Combine transaction evidence with interviews or surveys because people excluded from a rail are absent from its logs. Employment, productivity, and welfare effects require further research; they cannot be read directly from transaction growth.
From access to economic outcomes
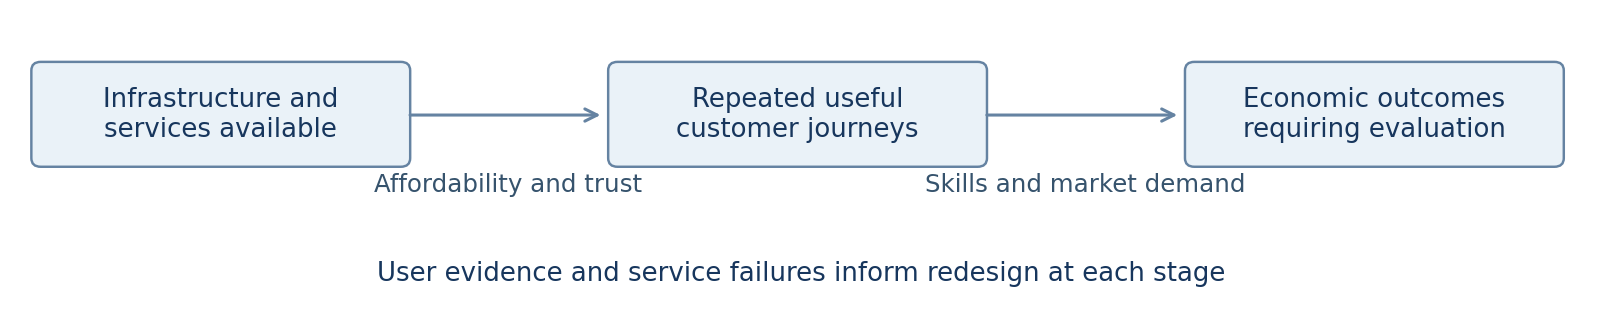
Assessment focus output; behaviour; outcome requiring evaluation.
Implications for practice
- Separate deployed capacity, active usage, and measured economic effects in reporting.
- Include non-users and excluded groups in research, not only transactions already on the rail.
Evidence & sources
Evidence and source note GIMAC portfolio reporting and activation work described in the practitioner record. Broader portfolio totals must remain separate from the harmonized corridor dataset. Demand-side context: [E].
These are practitioner reflections, not peer-reviewed impact studies or an official GIMAC or World Bank position. GIMAC figures come from the supplied notes and remain attributed to their reporting scope. New frameworks and diagrams are analytical proposals; they have not been validated as causal models. Approval, deployment, active use and economic impact are kept distinct.